DigitalOcean Kubernetes
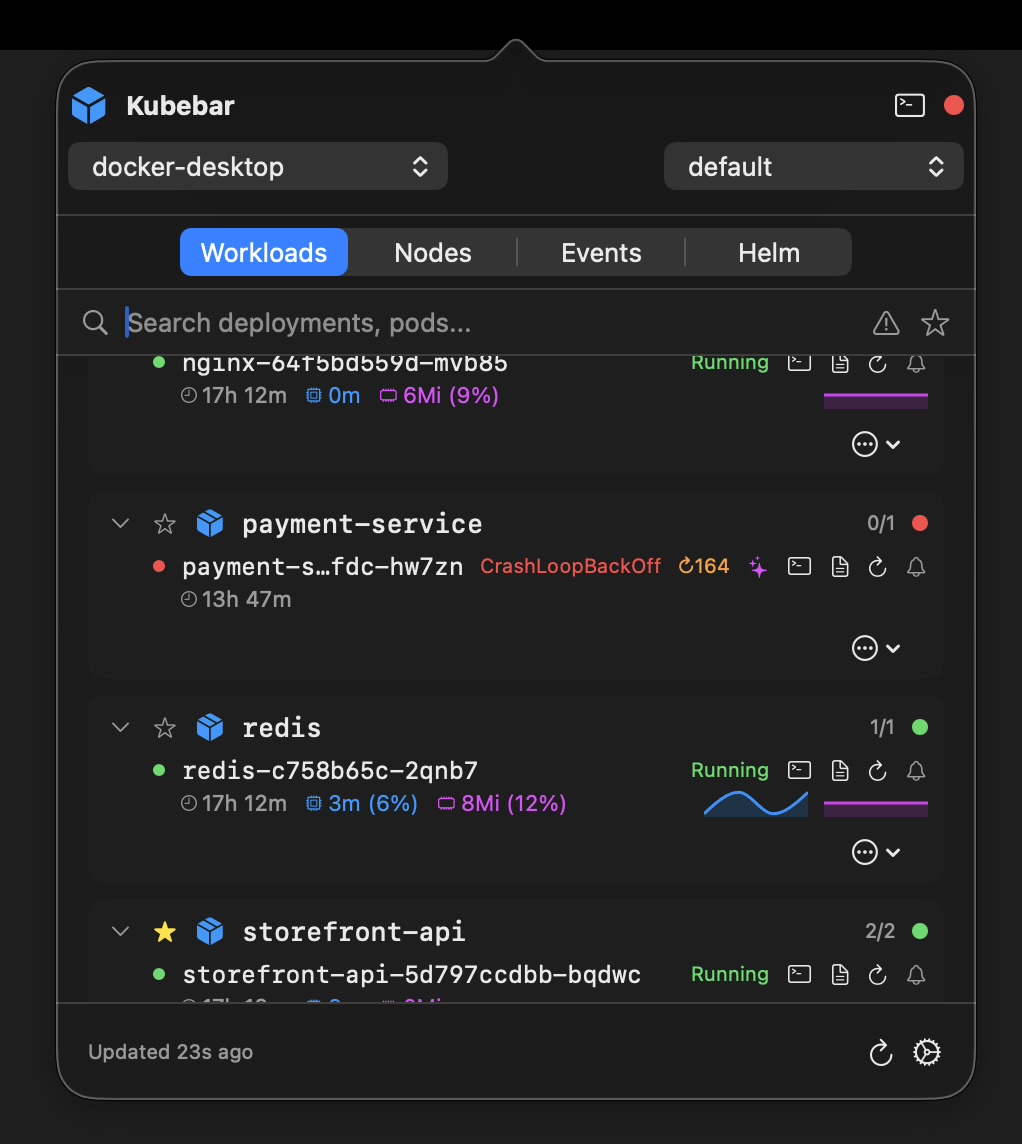
Keep your DigitalOcean Kubernetes clusters one click away - in the macOS menu bar and Windows tray. Health at a glance, live pod logs, one-click restarts and scaling. Connects through doctl kubernetes cluster kubeconfig save and your existing kubeconfig.
14-day free trial · from 12 € a year · no account required
doctl kubernetes cluster kubeconfig save writes - switch between DigitalOcean clusters from the menu bar.People choose DOKS because it is straightforward and cheap. Clusters here are often two or three nodes with a few gigabytes of RAM each - and that is exactly where an in-cluster monitoring stack hurts most. Prometheus plus Grafana plus exporters can claim a meaningful slice of a small node pool, which means either less room for your workloads or a bigger droplet than you wanted.
Kubebar moves that job to the machine you are already sitting at. It talks to the API server through your kubeconfig, so the cost on the cluster side is a few API calls - not a workload you have to size, patch and pay for.
| In-cluster Prometheus & Grafana | Kubebar | |
|---|---|---|
| Runs on | Your worker nodes | Your desktop |
| Node resources used | Noticeable on small pools | None |
| To install | 1-Click stack or Helm release | Nothing in the cluster |
| Metric history & dashboards | Yes - its main strength | Recent CPU/RAM sparklines only |
| Alert rules (PromQL) | Yes | No - threshold alerts only |
| “Is anything broken right now?” | Open a dashboard | Status dot, always visible |
| Act on a problem | Switch to a terminal | Restart or scale in one click |
These are complements, not substitutes: keep Prometheus if you need history and PromQL alerting. Kubebar covers the everyday question of whether something needs attention right now.
doctl kubernetes cluster kubeconfig save <cluster-name> merges the cluster into ~/.kube/config and handles the authentication token for you.Once your DOKS context is loaded, everything happens from the menu bar or tray - no control panel tab required.
The control panel is the right place to create clusters, resize node pools and manage tokens. It is not where you want to be when a pod is crash-looping: you sign in, navigate to the cluster, and still end up in a terminal to fix it. Kubebar keeps cluster health visible without signing in, and the fix - restart, scale, rollout undo - is a click away in the same menu.
Yes. Run doctl kubernetes cluster kubeconfig save <cluster> to merge the cluster into your kubeconfig, and Kubebar picks the context up automatically. Nothing is installed into the cluster.
It depends on what you need. DigitalOcean's 1-Click monitoring stack gives you metric history, dashboards and alert rules, and Kubebar does not replace that. What Kubebar replaces is opening a dashboard to answer “is anything broken right now” - and it does so without running anything on your worker nodes.
DOKS clusters are often small and cost-optimised - a couple of nodes with a few gigabytes of RAM each. An in-cluster Prometheus and Grafana stack takes a noticeable share of that. A desktop client uses your own machine instead, so your node budget goes to your workloads.
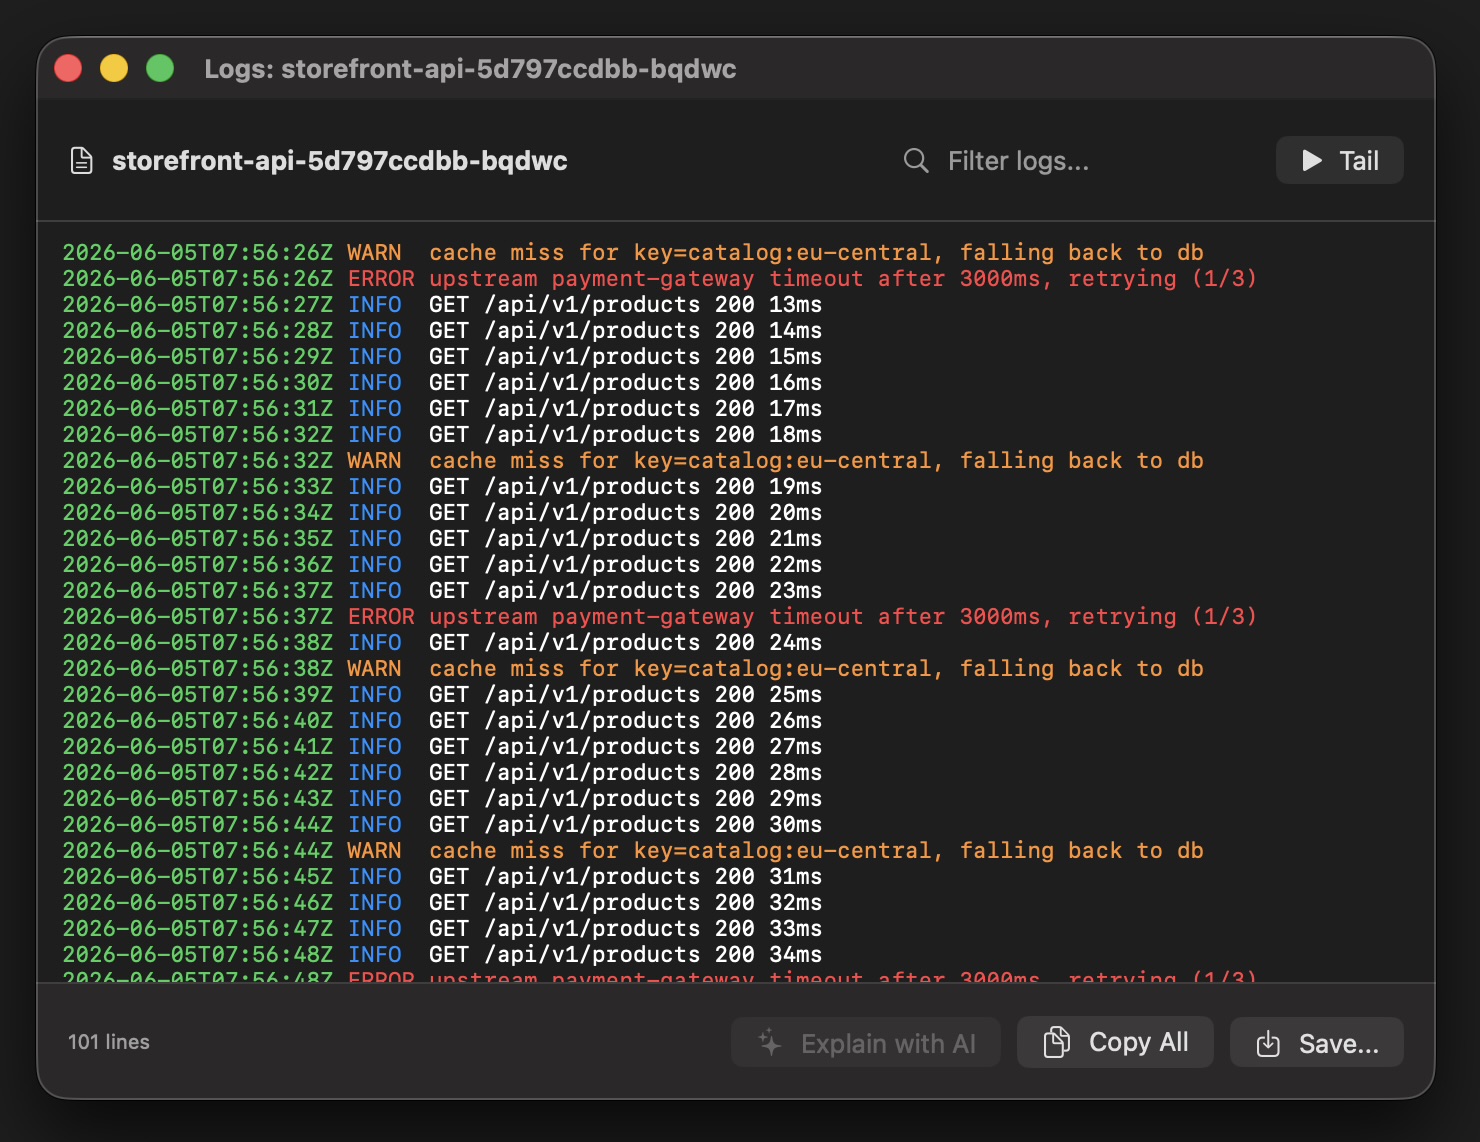
Cluster health at a glance with desktop alerts, live pod logs, one-click pod restarts, deployment scaling, rollout restart or undo, and cordon or drain on nodes - each behind a confirmation.